Data Validation & GBIF Validator
Overview
Teaching: 0 min
Exercises: 30 minQuestions
How to quality check my data before publication?
Objectives
Showing GBIF data validator
Data enhancement and quality control
Data validation with GBIF data validation tool
Recommended initial checks on your data
- Check that all the required Darwin Core terms are present and contain the correct information.
- Make a map from your data to ensure the coordinates are valid and within your expected range.
- Look at unique values of columns containing string entries to identify potential issues (eg. spelling).
- Check for uniqueness of
occurrenceIDfield. dwc:occurrenceID- Check for uniqueness of
eventIDfor each event, if applicable. dwc:eventID- Check that dates are following ISO-8601. dwc:eventDate
GBIF data validator
One method for data validation is fairly simple. The GBIF data validator
What is the GBIF data validator?
The GBIF data validator is a service that allows anyone with a GBIF-relevant dataset to receive a report on the syntactical correctness and the validity of the content contained within the dataset. By submitting a dataset to the validator, you can go through the validation and interpretation procedures usually associated with publishing in GBIF and quickly determine potential issues in data - without having to publish it.
How does it work?
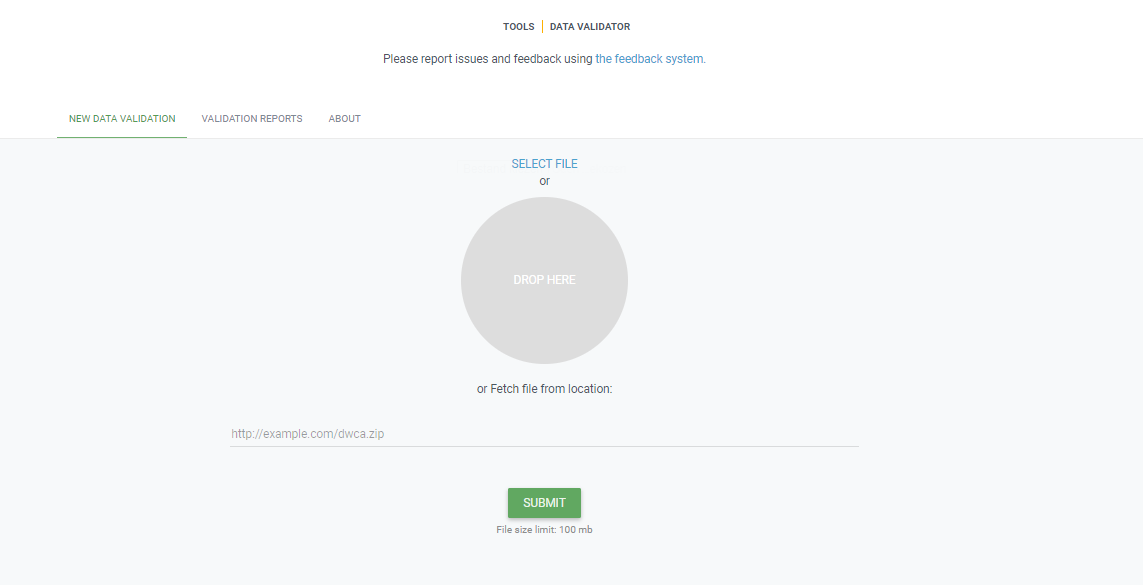
You start by uploading the dataset file to the validator, either by 1) clicking SELECT FILE and selecting it on your local computer or 2) dragging the file from a local folder and dropping it on the Drop here icon. You can also enter the URL of a dataset file accessible from the internet. This is particularly useful for larger datasets. Once you hit the Submit button, the validator starts processing your dataset file. You will be taken straight to a page showing the status of the validation.
Depending on the size of your dataset, processing might take a while. You don’t have to keep the browser window open, as a unique job ID is issued every time a new validation process is started. If your dataset is taking too long to process, just save the ID (bookmark the URL) and use it to return at a later time to view the report. We’ll keep the report for a month, during which you can come back whenever you like.
Which file types are accepted?
ZIP-compressed Darwin Core Archives (DwC-A) (containing cores Occurrence, Taxon, or Event). Integrated Publishing Toolkit (IPT) Excel templates containing Checklist, Occurrence, or Sampling-event data Simple CSV files containing Darwin Core terms in the first row
What information will I get from the validation report?
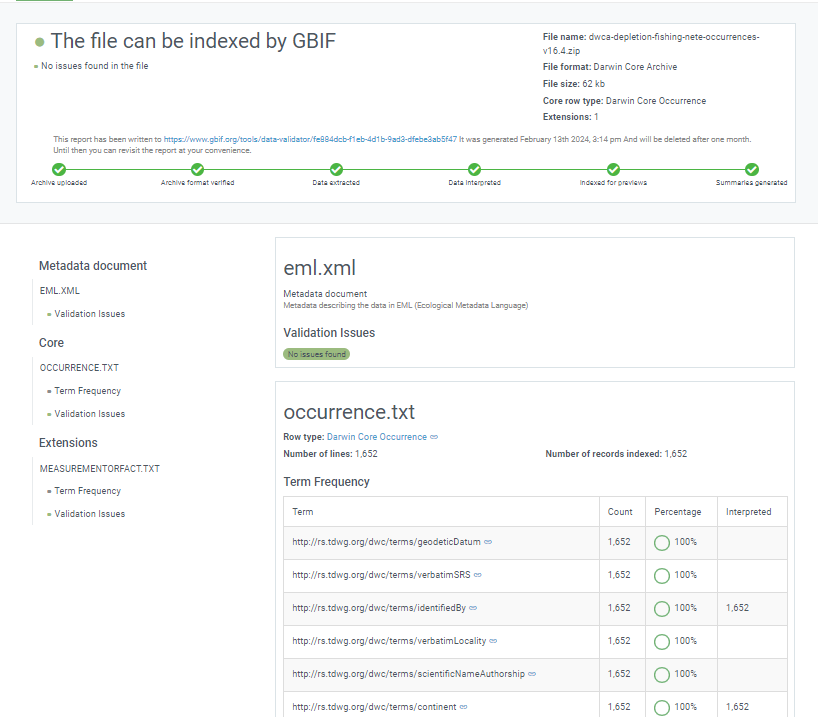
Once processing is done, you will be able to see the validation report containing the following information:
- a summary of the dataset type and a simple indicator of whether it can be indexed by GBIF or not
- a summary of issues found during the GBIF interpretation of the dataset
- detailed break-down of issues found in metadata, dataset core, and extensions (if any), respectively
- number of records successfully interpreted
- frequency of terms used in dataset
You will also be able to view the metadata as a draft version of the dataset page as it would appear when the dataset is published and registered with GBIF.
I’ve got the validation report - now what? If the validator finds that your dataset cannot be indexed by GBIF, you should address the issues raised by the validation report before you consider publishing it to GBIF. On the other hand, if you get the green light and your dataset is indexable by GBIF, you should still carefully review any issues that may be the result of e.g. conversion errors, etc. which could affect the quality of the data. If you find and correct any error - from a single typo to large systematic problems - feel free to resubmit your dataset as many times you like.
Technical details As with all GBIF tools and software, the data validator is an open source project. For more information, source code and documentation is available in a GitHub repository.
Exercises 1: Check a Dwc-a (Darwin Core Archive) in the GBIF validator
The GBIF validator is simple and easy to use.
- Go to the GBIF validator website
- Drop your DwC-a file (you can find an example file here dwc-a sample file or maybe use the dwc-a you published before in the IPT.
- Check the GBIF report on your dataset.
- Is your data ready to be published by GBIF?
Solution
- Check the validation status of your file
Hmisc Describe (optional)
Another method for reviewing your data is to use the r package Hmisc and the function describe. Expand the example below using output from this notebook to see how it works.
Hmisc::describe
# pull in the occurrence file from https://www.sciencebase.gov/catalog/item/53a887f4e4b075096c60cfdd
url <- "https://www.sciencebase.gov/catalog/file/get/53a887f4e4b075096c60cfdd?f=__disk__32%2F24%2F80%2F322480c9bcbad19030e29c9ec5e2caeb54cb4a08&allowOpen=true"

occurrence <- read.csv(url)

head(occurrence,n=1)
  vernacularName                                eventID occurrenceStatus
1  Alligator gar Station_95_Date_09JAN1997:14:35:00.000           Absent
     basisOfRecord       scientificName
1 HumanObservation Atractosteus spatula
                           scientificNameID  kingdom   phylum       class
1 urn:lsid:marinespecies.org:taxname:279822 Animalia Chordata Actinopteri
             order        family        genus scientificNameAuthorship
1 Lepisosteiformes Lepisosteidae Atractosteus        (LacepA"de, 1803)
  taxonRank organismQuantity organismQuantityType
1   Species                0   Relative Abundance
                                                 occurrenceID
1 Station_95_Date_09JAN1997:14:35:00.000_Atractosteus_spatula
         collectionCode
1 Aransas Bay Bag Seine

Hmisc::describe(occurrence)
occurrence 18 Variables 334341 Observations -------------------------------------------------------------------------------- vernacularName n missing distinct 334341 0 61 lowest : Alligator gar Arrow shrimp Atlantic brief squid Atlantic bumper Atlantic croaker highest: Striped mullet Thinstripe hermit Threadfin shad White mullet White shrimp -------------------------------------------------------------------------------- eventID n missing distinct 334341 0 5481 lowest : Station_10_Date_04DEC1991:13:59:00.000 Station_10_Date_04SEP2002:13:17:00.000 Station_10_Date_05JUN1991:15:20:00.000 Station_10_Date_07APR1995:12:54:00.000 Station_10_Date_07APR2000:11:16:00.000 highest: Station_99_Date_21APR1998:18:24:00.000 Station_99_Date_22OCT2001:13:12:00.000 Station_99_Date_25JUN1990:13:48:00.000 Station_99_Date_25NOV2003:11:11:00.000 Station_99_Date_27JUN1988:12:45:00.000 -------------------------------------------------------------------------------- occurrenceStatus n missing distinct 334341 0 2 Value Absent Present Frequency 294469 39872 Proportion 0.881 0.119 -------------------------------------------------------------------------------- basisOfRecord n missing distinct value 334341 0 1 HumanObservation Value HumanObservation Frequency 334341 Proportion 1 -------------------------------------------------------------------------------- scientificName n missing distinct 334341 0 61 lowest : Adinia xenica Anchoa mitchilli Archosargus probatocephalus Ariopsis felis Atractosteus spatula highest: Stomatopoda Stomolophus meleagris Syngnathus scovelli Tozeuma carolinense Trichiurus lepturus -------------------------------------------------------------------------------- scientificNameID n missing distinct 334341 0 61 lowest : urn:lsid:marinespecies.org:taxname:105792 urn:lsid:marinespecies.org:taxname:107034 urn:lsid:marinespecies.org:taxname:107379 urn:lsid:marinespecies.org:taxname:126983 urn:lsid:marinespecies.org:taxname:127089 highest: urn:lsid:marinespecies.org:taxname:367528 urn:lsid:marinespecies.org:taxname:396707 urn:lsid:marinespecies.org:taxname:421784 urn:lsid:marinespecies.org:taxname:422069 urn:lsid:marinespecies.org:taxname:443955 -------------------------------------------------------------------------------- kingdom n missing distinct value 334341 0 1 Animalia Value Animalia Frequency 334341 Proportion 1 -------------------------------------------------------------------------------- phylum n missing distinct 328860 5481 4 Value Arthropoda Chordata Cnidaria Mollusca Frequency 71253 246645 5481 5481 Proportion 0.217 0.750 0.017 0.017 -------------------------------------------------------------------------------- class n missing distinct 328860 5481 5 lowest : Actinopteri Cephalopoda Elasmobranchii Malacostraca Scyphozoa highest: Actinopteri Cephalopoda Elasmobranchii Malacostraca Scyphozoa Value Actinopteri Cephalopoda Elasmobranchii Malacostraca Frequency 235683 5481 10962 71253 Proportion 0.717 0.017 0.033 0.217 Value Scyphozoa Frequency 5481 Proportion 0.017 -------------------------------------------------------------------------------- order n missing distinct 328860 5481 22 lowest : Atheriniformes Batrachoidiformes Carangaria incertae sedis Carangiformes Carcharhiniformes highest: Rhizostomeae Scombriformes Siluriformes Syngnathiformes Tetraodontiformes -------------------------------------------------------------------------------- family n missing distinct 328860 5481 36 lowest : Ariidae Atherinopsidae Batrachoididae Carangidae Carcharhinidae highest: Stromateidae Syngnathidae Tetraodontidae Trichiuridae Triglidae -------------------------------------------------------------------------------- genus n missing distinct 328860 5481 52 lowest : Adinia Anchoa Archosargus Ariopsis Atractosteus highest: Sphoeroides Stomolophus Syngnathus Tozeuma Trichiurus -------------------------------------------------------------------------------- scientificNameAuthorship n missing distinct 328860 5481 52 lowest : (Baird & Girard, 1853) (Baird & Girard, 1855) (Blainville, 1823) (Bosc, 1801) (Burkenroad, 1939) highest: Rathbun, 1896 Say, 1817 [in Say, 1817-1818] Shipp & Yerger, 1969 Valenciennes, 1836 Winchell, 1864 -------------------------------------------------------------------------------- taxonRank n missing distinct 334341 0 3 Value Genus Order Species Frequency 5481 5481 323379 Proportion 0.016 0.016 0.967 -------------------------------------------------------------------------------- organismQuantity n missing distinct Info Mean Gmd .05 .10 334341 0 8696 0.317 0.01639 0.03141 0.00000 0.00000 .25 .50 .75 .90 .95 0.00000 0.00000 0.00000 0.01005 0.07407 lowest : 0.0000000000 0.0000917684 0.0001835370 0.0002136300 0.0002241650 highest: 0.9969931270 0.9974226800 0.9981570220 0.9982300880 1.0000000000 -------------------------------------------------------------------------------- organismQuantityType n missing distinct value 334341 0 1 Relative Abundance Value Relative Abundance Frequency 334341 n missing distinct 334341 0 1 value Aransas Bay Bag Seine Value Aransas Bay Bag Seine Frequency 334341 Proportion 1 --------------------------------------------------------------------------------
Exercise
Challenge: Perform the following minimal quality assurance and control checks:
- Run a diagnostics report for the data quality.
- Ensure that the eventIDs are unique.
- Make sure that the eventDates follow ISO-8601 standards.
- Determine whether reported depths are accurate.
The event core data used in the checks below can be found in this Excel file.
Solution in R
Install obistools R packages. Use readxl package to read the Excel file.
- Run a diagnostics report for the data quality
library(readxl)
library(obistools)

trawl_fish <- readxl::read_excel('data/trawl_fish.xlsx')
report <- obistools::report(trawl_fish)
report
- Check to make sure
eventIDare uniqueeventid <- obistools::check_eventids(trawl_fish) head(eventid)# A tibble: 6 x 4 field level row message <chr> <chr> <int> <chr> 1 eventID error 7 eventID IYS:GoA2019:Stn6:trawl is duplicated 2 eventID error 8 eventID IYS:GoA2019:Stn6:trawl is duplicated 3 parentEventID error 1 parentEventID IYS:GoA2019:Stn1 has no corresponding eventID 4 parentEventID error 2 parentEventID IYS:GoA2019:Stn2 has no corresponding eventID 5 parentEventID error 3 parentEventID IYS:GoA2019:Stn3 has no corresponding eventID 6 parentEventID error 4 parentEventID IYS:GoA2019:Stn4 has no corresponding eventID- Check for proper
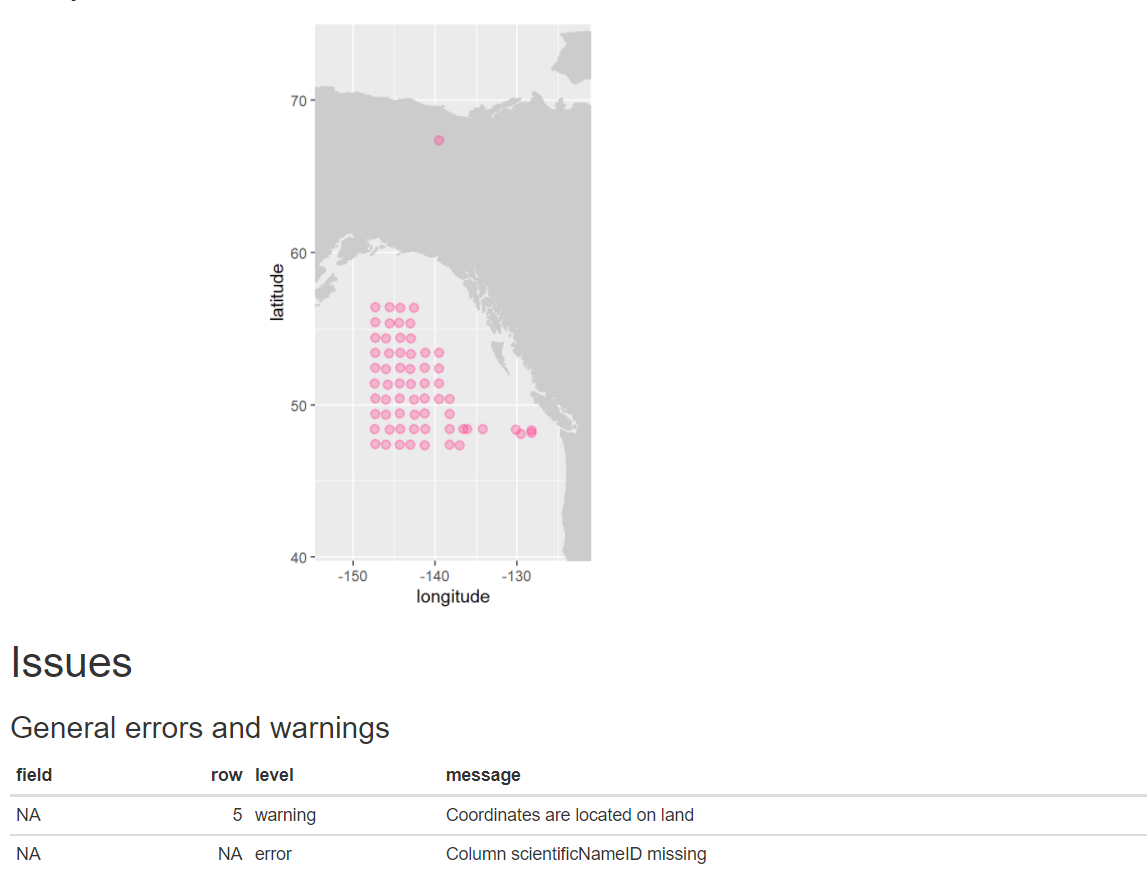
eventDateto ensure they follow ISO 8601 standards:eventDate <- obistools::check_eventdate(trawl_fish) print(eventDate)# A tibble: 3 x 4 level row field message <chr> <int> <chr> <chr> 1 error 10 eventDate eventDate 2019-02-24T07u40 does not seem to be a valid date 2 error 13 eventDate eventDate 2019-02-25 11h25min does not seem to be a valid date 3 error 15 eventDate eventDate 2019-26-2 does not seem to be a valid date- From the report generated under exercise 1, you can already see that there’s measurements made on land. This information can also be gathered by plotting the map separately or using the
check_onland()orcheck_depth()functions in the obistools package.depth <- obistools::check_depth(trawl_fish) onland <- obistools::check_onland(trawl_fish) # Gives the same output. print(depth)# A tibble: 1 x 16 eventID parentEventID eventDate year month day decimalLatitude decimalLongitude footprintWKT coordinateUncer~ minimumDepthInM~ <chr> <chr> <chr> <dbl> <dbl> <dbl> <dbl> <dbl> <chr> <dbl> <dbl> 1 IYS:Go~ IYS:GoA2019:~ 2019-02-~ 2019 2 22 67.4 -140. LINESTRING ~ 2313. 0 # ... with 5 more variables: maximumDepthInMeters <dbl>, samplingProtocol <chr>, locality <chr>, locationID <chr>, type <chr>Solution in Python
Install the pandas, cartopy, and geopandas Python packages. Use pandas to read the Excel file.
import pandas as pd
url = 'https://ioos.github.io/bio_mobilization_workshop/data/trawl_fish.xlsx'
df = pd.read_excel(url) # might need to install openpyxl
df['row'] = df.index.to_numpy()+1 # python starts at zero
- Run a diagnostics report for the data quality.
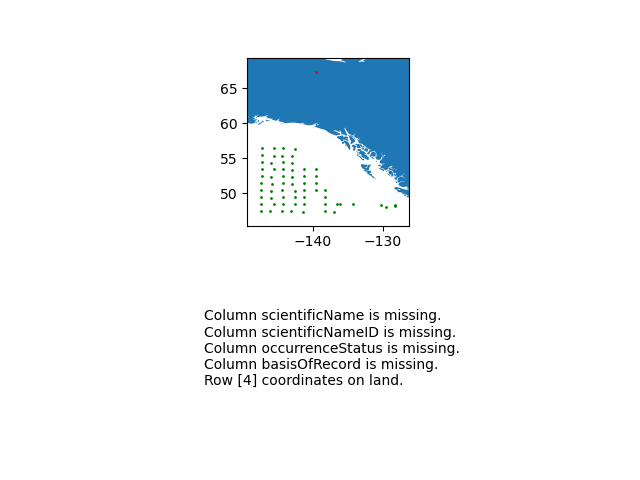
import cartopy.io.shapereader as shpreader
import geopandas as gpd
import shapely.geometry as sgeom
from shapely.ops import unary_union
from shapely.prepared import prep
import matplotlib.pyplot as plt

gdf = gpd.GeoDataFrame(df, geometry=gpd.points_from_xy(df.decimalLongitude, df.decimalLatitude))

land_shp_fname = shpreader.natural_earth(resolution='50m',
                                       category='physical', name='land')

land_geom = unary_union(list(shpreader.Reader(land_shp_fname).geometries()))
land = prep(land_geom)

for index, row in gdf.iterrows():
    gdf.loc[index, 'on_land'] = land.contains(row.geometry)

fig, axs = plt.subplots(ncols=1,nrows=2)
# Make a map:
xlim = ([gdf.total_bounds[0]-2,  gdf.total_bounds[2]+2])
ylim = ([gdf.total_bounds[1]-2,  gdf.total_bounds[3]+2])

axs[0].set_xlim(xlim)
axs[0].set_ylim(ylim)

gpd.read_file(land_shp_fname).plot(ax=axs[0])

gdf.loc[gdf['on_land']==False].plot(ax=axs[0], color='green', markersize=1)
gdf.loc[gdf['on_land']==True].plot(ax=axs[0], color='red', markersize=1)

# Collect some informational material about potential issues w/ data:
invalid_coord = []
if len(gdf.loc[gdf['on_land']==True]) > 0:
   invalid_coord.append('Row {} coordinates on land.'.format(gdf.loc[gdf['on_land'] == True,'row'].tolist()[0]))

req_cols = ['eventDate', 'decimalLongitude', 'decimalLatitude', 'scientificName', 'scientificNameID', 'occurrenceStatus', 'basisOfRecord']
missing_cols = []
for col in req_cols:
 if col not in gdf.columns:
   missing_cols.append('Column {} is missing.'.format(col))

# Add the information to the figure
axs[1].text(0.25,0.25,'\n'.join(['\n'.join(missing_cols),'\n'.join(invalid_coord)]))
axs[1].axis('off')
plt.show()
- Check to make sure
eventIDare uniquedup_events = df.loc[df['eventID'].duplicated()] print('Duplicated eventID:\n',dup_events[['eventID','row']]) parent_not_event = df.loc[~df['eventID'].isin(df['parentEventID'].unique())] print('\nparentEventID missing corresponding eventID:\n', parent_not_event[['parentEventID','row']])Duplicated eventID: eventID row 6 IYS:GoA2019:Stn6:trawl 7 7 IYS:GoA2019:Stn6:trawl 8 parentEventID missing corresponding eventID: parentEventID row 0 IYS:GoA2019:Stn1 1 1 IYS:GoA2019:Stn2 2 2 IYS:GoA2019:Stn3 3 3 IYS:GoA2019:Stn4 4 4 IYS:GoA2019:Stn5 5 .. ... ... 59 IYS:GoA2019:Stn60 60 60 IYS:GoA2019:Stn61 61 61 IYS:GoA2019:Stn62 62 62 IYS:GoA2019:Stn63 63 63 IYS:GoA2019:Stn64 64 [64 rows x 2 columns]- Check for proper
eventDateto ensure they follow ISO 8601 standards:for date in df['eventDate']: try: pd.to_datetime(date) except: print("Date",date,"might not follow ISO 8601")- From the report generated under exercise 1, you can already see that there’s measurements made on land. Now let’s check the depths are within reason for the points. Let’s use the GEBCO bathymetry dataset served in the coastwatch ERDDAP.
import time
import numpy as np

df['bathy'] = np.nan # initialize column

for index, row in df.iterrows():
    base_url = 'https://coastwatch.pfeg.noaa.gov/erddap/griddap/GEBCO_2020.csvp?'
    query_url = 'elevation%5B({})%5D%5B({})%5D'.format(row['decimalLatitude'],row['decimalLongitude'])
    url = base_url+query_url
    bathy = pd.read_csv(url)
    df.at[index,'bathy'] = bathy['elevation (m)'] # insert bathymetry value
    time.sleep(0.5) # to not ping erddap too much

# make new column for depth in meters as negative because GEBCO is Elevation relative to sea level
df['neg_maximumDepthInMeters'] = -1*df['maximumDepthInMeters']

print('maximumDepthInMeters deeper than GEBCO bathymetry:')
if len( df.loc[df['neg_maximumDepthInMeters'] < df['bathy']] ) > 0:
   print(df.loc[df['neg_maximumDepthInMeters'] < df['bathy']].T)
else:
   print('None')
maximumDepthInMeters deeper than GEBCO bathymetry: 4 eventID IYS:GoA2019:Stn5:trawl parentEventID IYS:GoA2019:Stn5 eventDate 2019-02-22T09:49:00Z/2019-02-22T10:49:00Z year 2019 month 2 day 22 decimalLatitude 67.399004 decimalLongitude -139.552501 footprintWKT LINESTRING ( -139.583 67.397 , -139.522 67.401 ) coordinateUncertaintyInMeters 2313.094678 minimumDepthInMeters 0 maximumDepthInMeters 33.2 samplingProtocol midwater trawl locality NaN locationID NaN type midwater trawl row 5 bathy 306.0 neg_maximumDepthInMeters -33.2
Data Publishing Pipeline
After going through QAQC and being standardized to Darwin Core, the dataset are uploaded to an IPT. Metadata is added in the form of EML and the dataset published as a Darwin Core Archive (DwC-A). The data are then pushed to central OBIS. Each dataset also has the option of being pushed to GBIF through the OBIS IPT.
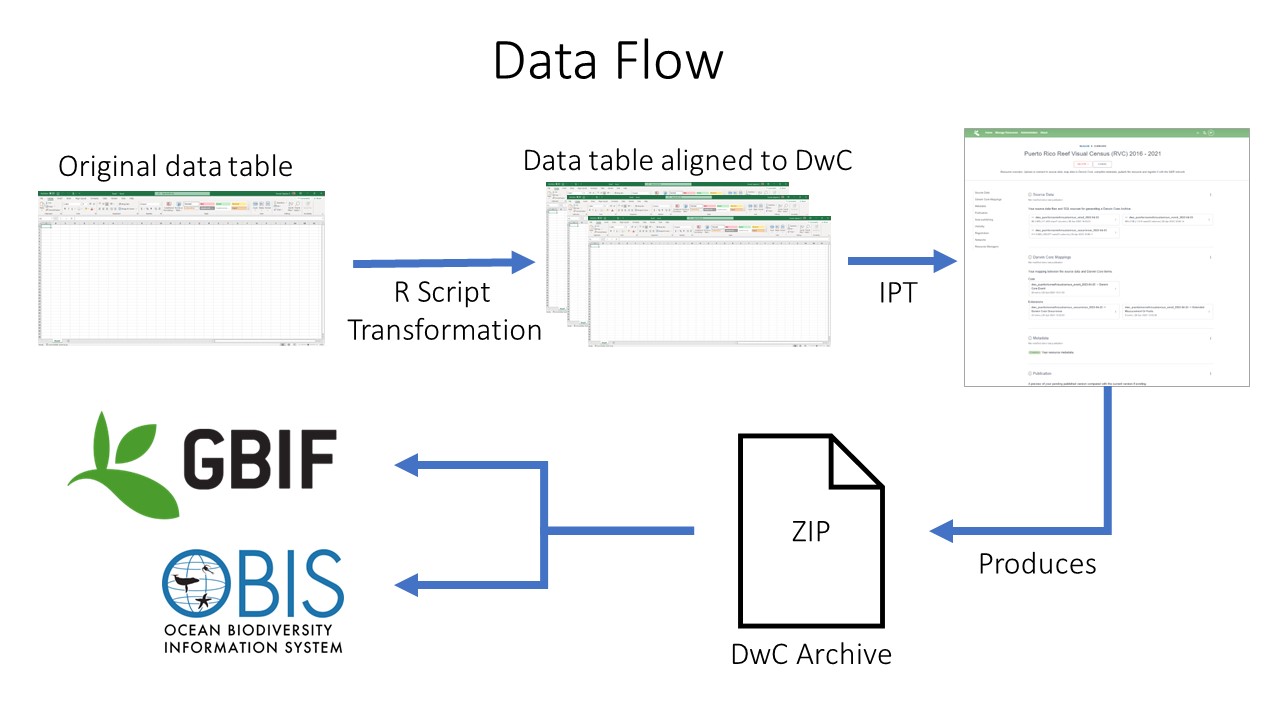 Data publishing pipeline. Image credit: Enrique Montes
Key Points
Use at least the GBIF data validator before you publish data on the network